A single AI visibility audit is a snapshot. It tells you how AI answer engines see your brand on the day it was run, which is the right place to start. The question that always follows is about direction. Are we getting more visible or less? Did the content we shipped in June actually move anything, or did a competitor just pull ahead?
AI answers are noisy, so a one-time reading can only say so much. This month we added a full over-time layer to HiBot. Put an audit on a recurring monthly or quarterly schedule and every report after the first compares itself to the ones before it. Here is what that unlocks, and why tracking beats a one-off reading for anyone serious about AI visibility.
Why One Audit Is Only a Starting Point
Answer engines change their responses week to week as models update, as sources shift, and as your competitors publish. A number you measured once, in isolation, cannot tell you whether that number is normal, improving, or slipping. Trends turn a single data point into a line you can actually manage against. They are also the clearest proof of ROI an agency can put in front of a client: not "your score is 62," but "your score went from 48 to 62 over the quarter we worked together."
Dimension Trends, Not Just the Headline
Each re-audit traces all six ANSWER dimensions across every run, not only the top-line HiBot Score. Every dimension carries two deltas: how it moved since your baseline, and how it moved since your last run. You can see that your Appearance climbed steadily while your Worth score stalled, instead of watching a single blended number wobble and learning nothing.
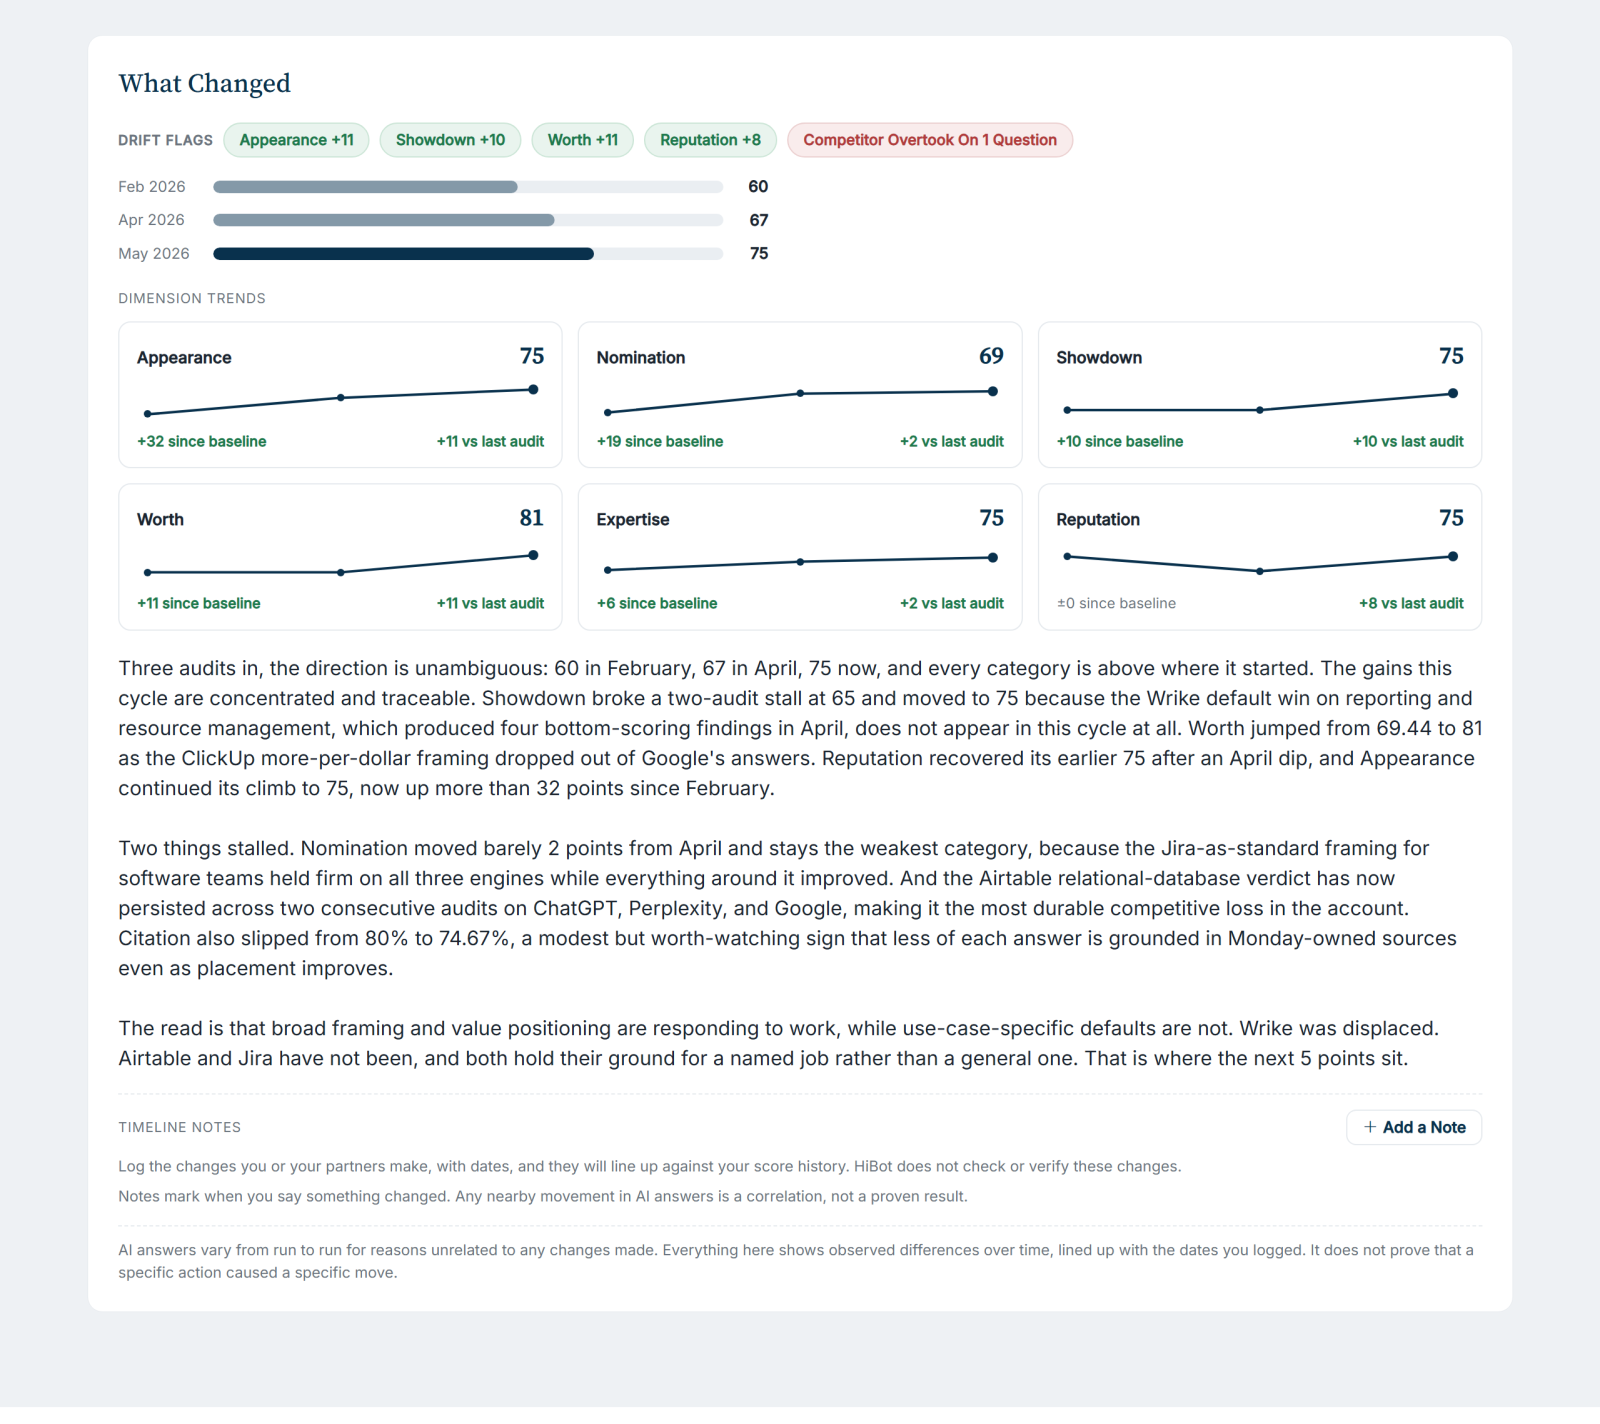
Shown here: from a HiBot demo account audit series, three quarterly runs of the same brand.
See dimension trends on the features page.
Drift Flags Find the Story for You
You should not have to read a chart to find what changed. Drift flags call out the material moves and the stalls automatically. If Worth jumped six points, Reputation has not budged in three cycles, or a single question regressed, the report says so in plain language at the top. It is the difference between data and an insight.
What Changed, Question by Question
The most persuasive view is the question-level one. For every question in your locked set, the report shows how you moved between runs: where you newly appeared, where you dropped out, where your score rose or fell, and where a competitor overtook you, named. A full compare view goes all the way down to each individual engine.
For an agency showing a client the result of a quarter's work, this is the single clearest artifact you can put on the table. "On this exact buying question, you went from invisible to the recommended pick, and here is the competitor you displaced."
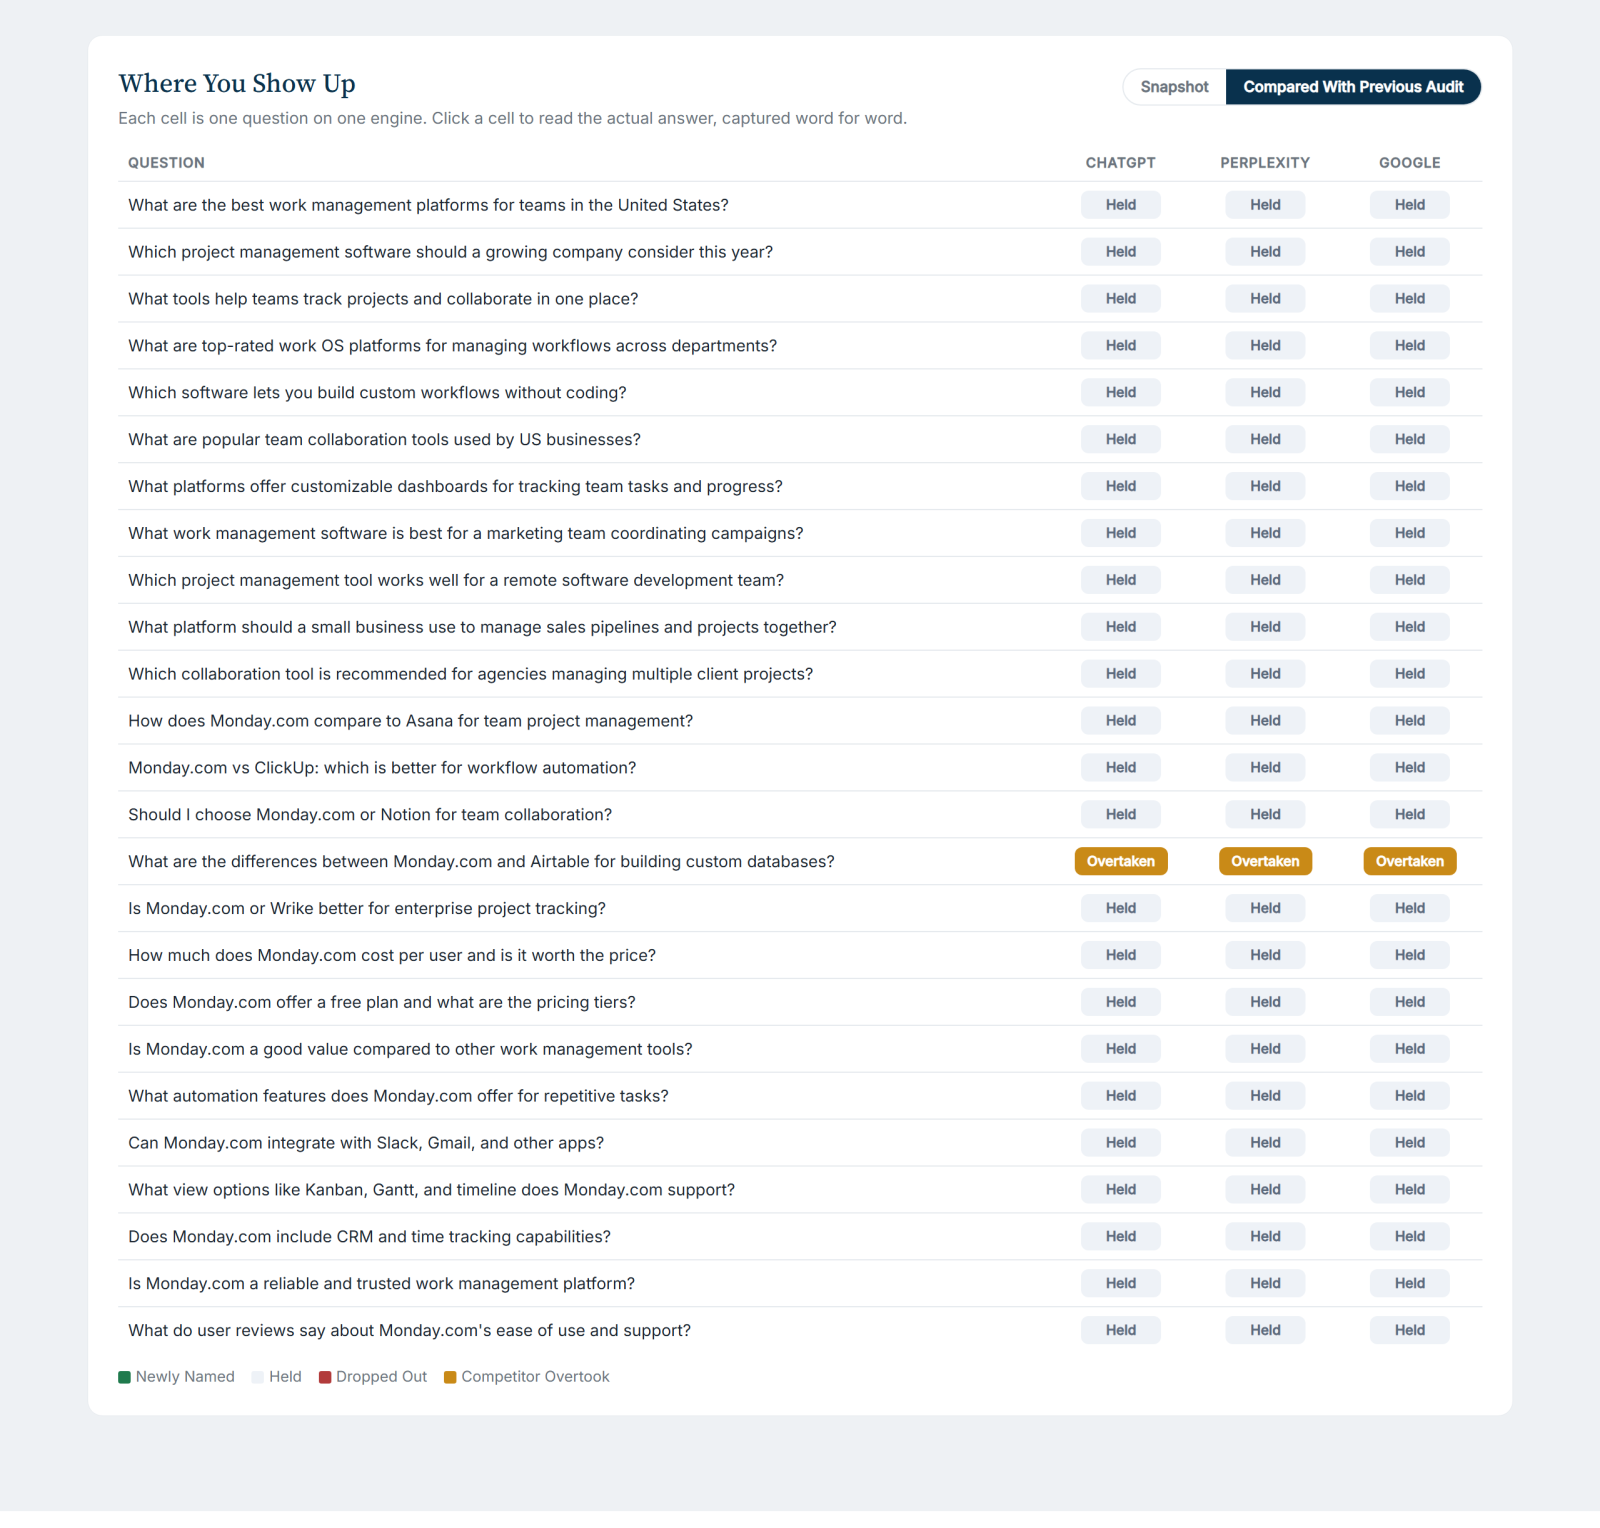
Explore question-level changes.
An Accuracy Tracker, Not Just a Log
The hallucination log becomes a tracker across runs. Every false claim an engine made about you is tagged as new, persisted, corrected, or reappeared, alongside an accuracy-rate line across every cycle. A claim you fixed and the engines stopped repeating shows up as a win. A claim that keeps coming back is flagged so you know it is still out there, doing damage. See accuracy over time.
Timeline Notes Pinned to Your Score History
You can log the changes you or your partners make, with dates, and they appear as pins on your score history. When a redesigned pricing page in May lines up with a Worth gain in July, the note is right there next to the movement, so the story of the work is legible months later.
One honest caveat, and we build it into the product itself: HiBot verifies nothing about cause. A note near a rise is a correlation, never proof that one caused the other. AI answers move for many reasons, and we would rather show you an honest timeline than sell you a false one. See timeline notes.
Where You Show Up, at a Glance
A presence matrix lays out every question against every engine, each cell showing whether you were named, absent, or the engine returned nothing. Click any cell to read the actual response, and a compare mode overlays what flipped since the last run, so a wall of green or red tells you the state of your coverage in one look.
See the presence matrix.
Competitive Standing on Both Plans
Competitive standing, how often AI names you versus the category leader and where you rank among every brand you track, now headlines every report on both Pulse and Panorama, not just the larger plan. Alongside it, share of voice turns raw mentions into a ranked leaderboard with a first-mention breakdown by engine, and coverage by model shows the share of each engine's answers that actually name you. Whenever you track a competitor, you see exactly where a rival is winning the recommendation.
Common Questions
How does HiBot track AI visibility over time?
Put an audit on a recurring monthly or quarterly schedule. HiBot clones your locked question set each cycle so results compare like for like, then every report after the first adds trends, drift flags, question-level changes, an accuracy tracker, and a presence-matrix compare against prior runs.
Do recurring audits cost more?
No. Recurring audits cost less per run than one-off audits, and they are the only way to get the full over-time layer described here.
Can I prove the audit caused a change?
HiBot shows correlation, not causation. Timeline notes let you line up your own changes against score movement, but the product is careful never to claim one caused the other, because AI answers shift for many reasons.
See how Pulse and Panorama compare on the features page, or start a recurring series and begin building your own trend line. Want a finished example first? Download a real report on the case studies page.